Saturday, July 30, 2005

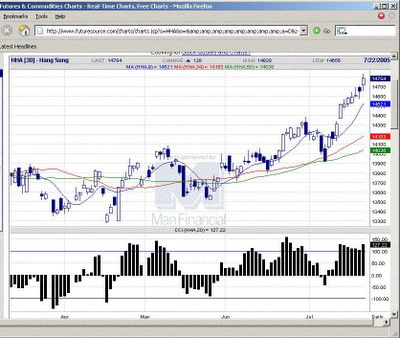
20050729 CCI grinding along +100 line, could be indication of strength of uptrend, but can't help but think overbought conditions may have to ease through retracement. Overnight 29/7 Dow and US indices fell, could be trigger for retracement. Posted by Picasa

Thursday, July 28, 2005

20050728 An indecisive candle, balanced buying and selling. Momentum flattening out, although still on positive bias. Looking for a new 20 day high to be put in place to setup a turtle reversal sell at 14825. Posted by Picasa

20050727 HSI morning trade. Posted by Picasa

Wednesday, July 27, 2005

20050726 Bulls not convinced to push index to new highs with yet another candlestick showing selling interest. Posted by Picasa

Monday, July 25, 2005

20050725 Continuing on the upside move with the CCI above +100. Candlestick pattern toda shows selling interest, most likely profit taking. 14695 is a trigger point for a turtle soup reversal swing trade tomorrow, which will set up after a new high prints on tomorrow's chart. Posted by Picasa

Saturday, July 23, 2005

20050722 Day after China abandons peg on yuan and moved to a managed float. Momentum builds again. Posted by Picasa

Friday, July 22, 2005

20050722 Big doji candle indicates indecision with balance between buyers and sellers. Neet to see who gets upper hand from here but momentum still good with CCI > +100. Cross below this indicate good time to profit take or aggressive short. Posted by Picasa

Thursday, July 21, 2005

20050720 CCI below +100, momentum waning Looking for cross above +100 for long signal again. Posted by Picasa

Tuesday, July 19, 2005

20050718 Upside momentum still very strong, with the CCI above +100, carrying the HSI to new highs. Posted by Picasa

Saturday, July 16, 2005


20050715 Candle looks like selling interest coming in, but this could be due to position squaring for the weekend. New 20 day high made today, turtle soup short reversal swing not triggered today, but setup still there. Posted by Picasa

Friday, July 15, 2005


20050714 HSI continues the strong run. Level to focus on is the previous 20 day high made 10 trading days ago: 14380. If this level comes, sets up a counter trend reversal short signal with a stop at 14 July high. Posted by Picasa

Thursday, July 14, 2005


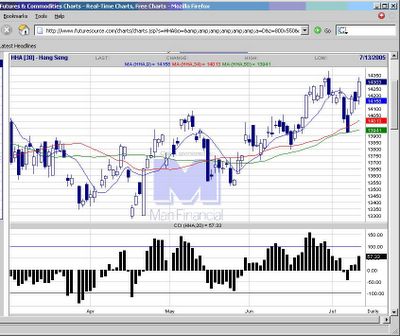
20050713 Support at 14158 for the upward mrch. Posted by Picasa

Tuesday, July 12, 2005


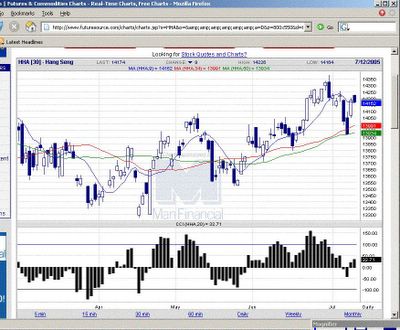
20050712 11:17 am HSI now undergoing consolidation support 13991 denoted by mov avg. Should scribe the triangle formation for the brk out either side, see what pans out. Posted by Picasa

Friday, July 08, 2005


20050707 14187 is the resistance level now Trapped within the moving avg, HSI likely to range trade. Posted by Picasa

Thursday, July 07, 2005


20050706 CCI broke below the +100, indicating a significant slowdown in momentum and sell signal for bulls to proit take and aggressive short trade targeting the moving average support. But the trend stil remains up on the daily chart. Posted by Picasa

Wednesday, July 06, 2005


20050705 Continuing on correction for 3 days now. Could be 2 more days to match the previous significant correctin, which lasted 5 days in mid June. Posted by Picasa

Tuesday, July 05, 2005


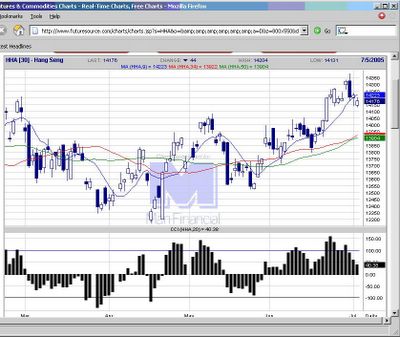
20050704 Closes right on the moving average. Support provided by the lower 2 mov avg. But candlestick pattern shows bullish move off July 4 bounce off the mov avg. Further upside seen but could be muted due to the divergence. No strong indication either side, could be two way trade. Posted by Picasa

Friday, July 01, 2005

20050630 Testing the support levels of the previous high made in February, which would be a Turtle Soup reversal short signal. Next support level 14085, also a previous high. Posted by Picasa