Friday, June 29, 2007


20070629 1031. Short area for the HSI futures today is at 22035-25, the support line drawn from the thrust bars down out of the low volatility zone.

Thursday, June 28, 2007


20070628 1136. Breakeven stops would have been hit. Now is a question of whether the 'thrust' down can be shorted. When momentum turns, the 'thrust bars' on the HSI futures gives clues to the sustainability of the follow through selling.


20070628 1117. HSI futures breaks out of 22025 and moves to 22062 high. Proper money management is to take risk off table by booking profits on 1/2 position and holding on to the second half.


20070628 1059. 22020-25 is the buy region, with the resistance line, low volatility region and thrust bars. Will look to buy on the breakout and close above the 22020 line for the Hang Seng futures.

Friday, June 22, 2007


20070622 1503. HSI futures on nice trend. However there is no trade, as the breakout didn't come from a low volatility region.(red dots) Patience is a good virtue for traders to have.


20070622 1131. An example of one that failed to work out. Close the position and wait for next opportunity would be the best psychological approach. Dwelling on the past is not a good thing for trading.


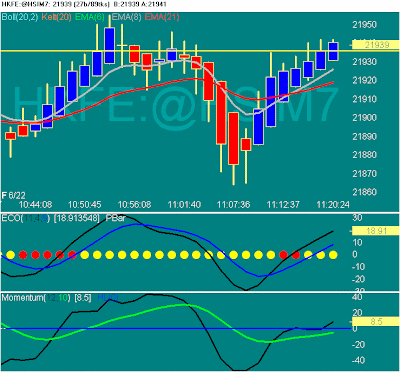
20070622 1120. With two red dots and thrust bars, long signal triggered at 21937-42 area. Let's see what happens.


20070622 1044. Two red cnadlesticks indicates time to get out of the positiion. After that, you can see the loss of momentum, justified the decision not to overstay your welcome.


20070622 1025. A relative quick and smooth move up to the first target area, for this long trade. What psychology drives this type of move? Think is driven by the shorts covering. These were the 'Johnny come lately's who piled into shorts at the bottom thinking it was the end of the world.


20070622 1016. Long signal triggers at 21848-53 region. Use appropriate risk managemnet.

Thursday, June 21, 2007


20070621 1556. HSI futures trading into the close. Can you spot the buy signal and where it triggered? Use the rules and trades pops out at you.


20070621 1154. 2 red bars means exit last 1/2 position at around 12180-85.


20070621 1105. 70 point travel means profits can be locked in on 1/2 of the position on the HHI futures. Exit signal on the remainder will be based on discretion.


20070621 1044. China H share index futures buy signal at 12026-30 region. No signal on HSI futures (no red dots) means this alternative can be considered.

Wednesday, June 20, 2007


20070620 1200. HSI futures 89 tick view. The trend was so strong, even entering the long squeeze trade at 21790 had nice follow through.


20070620 1156. 5 min HSI futures chart today. The time to jump in was the pullback to the zone between the 10 and 21 exponential moving average, for a nice long trade.

Monday, June 18, 2007


20070618 1230. The elements were there (see last post) for the breakout long trade at 21435-40 area. This is the type of smooth trades every trader wants to look for.

Friday, June 15, 2007


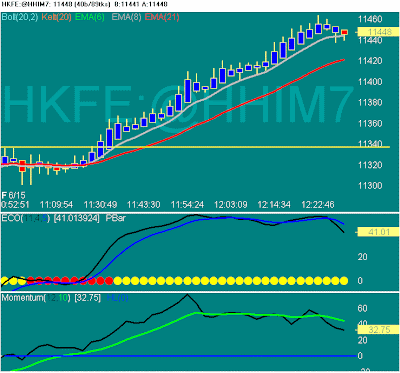
20070615 1230. The corresponding buy on the HHI (China H share index) futures proved much cleaner, with better follow through. We might follow this index futures contract for a while from now on.


20070615 1214. HSI follows through. Two red bars shows indications for exit.


20070615 1137. We have the elements in place:
  • Red dots indicate low volatility region
  • 2 'thrust bars forms high
  • Breaking through the high indicated buy at 20950-55 region
  • Momentum indicators confirm the long trade

Thursday, June 14, 2007


20070614 1533. 140 pt move from where the buy signal fired off on the HSI futures.


20070614 1431. Breakout in the HSI futures came to the upside, from 20760. Elements were there, the red dots and the 'thrust' candles.


20070614 1100. Break came to upside, so the short trade was passed on.(no trigger)


20070614 1041. Coming into a moment of truth. Might be taking shorts at 20720, on move out of low volatility region and some indications for downside move.

Wednesday, June 13, 2007


20070613 1230. HSI futures reaches high 20624. A good long signal, but traders need to learn how to hold on to positions to make these type of gains.


20070613 1205. Long signal at 10560, on the break of the previous high. Low volatility zones provide the best breakout trade points to trade from.


20070613 1021. HSI breaks the high of the ADX range for the buy signal at 20516. Movement out of low volatility region.

Friday, June 08, 2007


20070608 1457. No momentum from follow through selling. 2 blue bars appears, we cover.


20070608 1448. Sell signal on HSI 20454.

Thursday, June 07, 2007


20070607 1134. Taking the corresponding long reverse trade makes back the losses.


20070607 1120. Position stopped at 20635.


20070607 1052. Trying the short at 20612 on the HSI futures on short squeeze signal.

Tuesday, June 05, 2007


20070605 1151. HSI futures moves further down.


20070605 1125. A better trade was the short, again triggered by a move out of the congestion area at 20765.


20070605 1006. Long signal on the second bar of the day (higher risk) yields good movement upside for HSI futures.

Monday, June 04, 2007


20070604 1230. A long signal at 20830, price action confirms move out of low volatility region.

Friday, June 01, 2007


20070601 1230. HSI ends about 100 points up from the buy point.


20070601 1131. Turning long provided better trade.


20070601 1058. They don't always work out, this one was stopped out.


20070601 1043 Short signal at 20705 for HSI. Immediate exit of 1/2 position at 15 points remainder runners with stop at 35.