Thursday, August 30, 2007


20070830 1522. Having the nerve to hold through any short squeeze, would have paid off in the end, as HSI futures proceeds to sell down.


20070830 1453. HSI futures short setup fails. Sometimes we succumb to the greed factor, thinking that it would collapse in this case.


20070830 1436. HSI gaps down and fires off a short squeeze signal. Can it go down further?

Wednesday, August 29, 2007


20070829 1609. Another short and long signal in afternoon trade. Seems that ong signals have more momentum and follow through. Is this a sign on the direction of the market going forward? Time will tell.


20070829 1436. HSI futures long squeeze fires off on the opening gap up, aftr the session break. Will take some guts to do this type of trade.

Thursday, August 23, 2007


20070823 1457. 3 short signals in the afternoon session for HSI futures. The problem with the first 2 setups is the lask of initial followthrough, with the ensuing retracement upwards surely to have hit stops. No setup is infallable, and is prone to failure.


20070823 1056. Another short squeeze setup. If you don't honour the stops and money managmenet principles, sudden reversals the other way like this one on the HSI futures will kill the trading account balance.


20070823 1032. Long squeeze at 22940, fails into a stop out. As with all trading methods, is prone to some failures. The key is to make the overall trading apporach meangful, but to mane any one individual trade meaningless. Got this quote from Kathy Lien's book. This is very apt way of thinking to improve psychology for trading.


20070823 1007. A very quick short squeeze setup on the HSI 50 tick chart. Price 23060-70 area. Need quick fingers with direct access trading to trade these types of fast markets. Incidently HSI futures gapped up over 700 pts today.

Tuesday, August 21, 2007


20070821 1439. HSI futures short squeeze trade in the afternoon on the 50 tick chart. Been having good responsive price action for squeeze trades in these volatile markets.


20070821 1016. HSI futures fires off a long squeeze, with momentum supporting this morning.

Friday, August 17, 2007


20070817 1555. Capitulation, followed by a stunning reversal on the HSI futures. The crowd that said after the lunch session break "I don't care what price sell sell sell, get me the f*^&^ out!", as always are the last out.=capitulation.


20070817 1520. Have to post this 45 tick HSI futures chart, which is an afternoon rebound. A refreshing change to see a 45 degree upward sloping chart amid the turmoil of crashing equity indices recently.


20070817 1023. HSI futures short squeeze on 45 tick.

Thursday, August 16, 2007


20070816 1146. HSI futures moves just above 20700, but penetrates the pivot level again. This underlies the importance of money management to recognise when the trade goes wrong and get out.


20070816 1112. Long HSI on breakthrough 20664.

Wednesday, August 15, 2007


20070815 1108. Longs could only go in favour by 30 points or so, before reversing. Times like this the stop loss and money management stops will save the day and minimise losses.


20070815 1006. HSI futures S3 level provided the buying opportunity at 21524. Let's see what happens.

Monday, August 13, 2007


20070813 1459. The trade for today was the reversal off the daily pivot point for the HSI futures.

Friday, August 10, 2007


20070810 1035. HSI futures long squeeze at 21690-700 area. 25 tick seems to provide some signals today. The initial long from the S4 support hits the S3 (more or less), but the profits should be good enough to bank.


20070810 1003. HSI futures S4 support came in at 21614. A long at this level is good for >85 points. Times of turmoil provides this type of opportunity for a calculated risk trade.

Wednesday, August 08, 2007


20070808 1434. HSI futures moved from pivot to pivot. A buy signal at the break of the first pivot high. Holding on would have been profitable. Like they say in basketball, "..going coast to coast" or "running the length of the floor for the lay up..". There was no reason to be short as the DMI wasn't supportive.

Tuesday, August 07, 2007


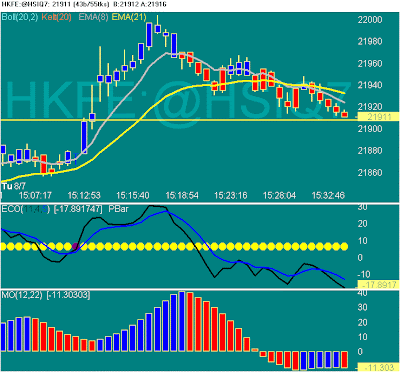
20070807 1534. 2 red cnadles mean the momentum was lost the the long need to be liquidated for the HSI futures.


20070807 1515. Afternoon trading sees a long squeeze firing off on the HSI futures.


20070807 1445. On the pivots side, the gap up into pivot level 21977 region provided the opportunity for the short trade.


20070807 1230. HSI move on this one is almost 200 points.


20070807 1206. HSI short squeeze fires off for the nice move down. The pivot strategy, to sell at the nearest pivot level on the first test, is a patient way to get some profit from the volatile markets.

Monday, August 06, 2007


20070806 1610. HSI futures couldn't reach the target of the next pivot level upside. In fact prices moved down below the support buy level.


20070806 1150. HSI futures reached 22050, from the long at the pivot level 21937.


20070806 1037. HSI futures next pivot level 21937 provided the next opportunity for the scalp buy trade. Currently in favour by about 35 pts.


20070806 0954. In times of turmoil, pivot levels could provide the trading opportunities. 22090 provided the first test buy today on the HSI futures, with target at the next pivot level.

Friday, August 03, 2007


20070803 1110. HSI futures continues to head lower, after the initial short signal.


20070803 1048. 55 tick chart provided a squeeze play short trade opportunity. A relatively quick and painless trade.

Wednesday, August 01, 2007


20070801 1230. HSI ends the morning session down >870 points. A day and chart worth noting for the meltdown of the overexuberated stock speculators bubble.


20070801 1131. HSI futures tumbles today. The sell signal ocmes from the dots changing colour on the 89 tick chart. Going to shift to this chart from the old setup.