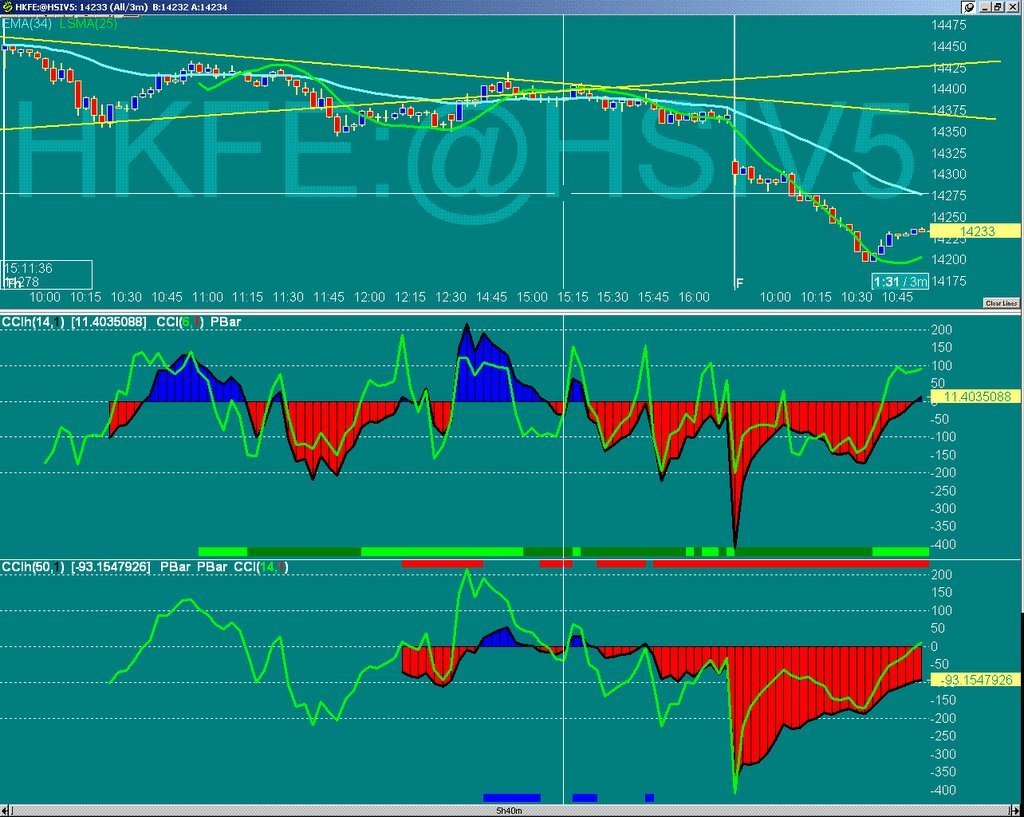
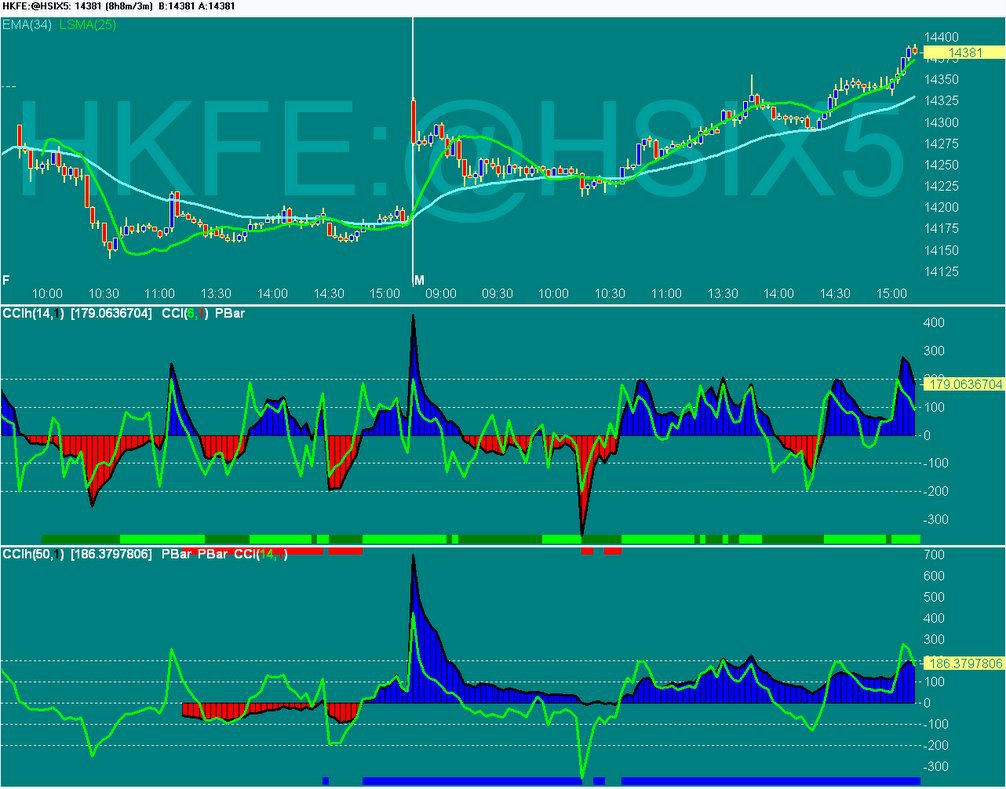
 20051031 After the initial gap up and pull back into support levels, the HSI moves up in a trenda day pattern, closing near highs. The move should continue into Tuesday.
posted by emacro @ 4:38 PM
0 comments
![]()
![]()
The Hang Seng Index Futures (HSI) traded on the Hong Kong Exchange is a highly volatile trading instrument, which can lead to huge losses or gains. This will chronicle and log trade setups for this futures contract on an intraday basis. Using technical analysis to try to profit from swings in the market.
20051031 After the initial gap up and pull back into support levels, the HSI moves up in a trenda day pattern, closing near highs. The move should continue into Tuesday.
posted by emacro @ 4:38 PM
0 comments
![]()
![]()
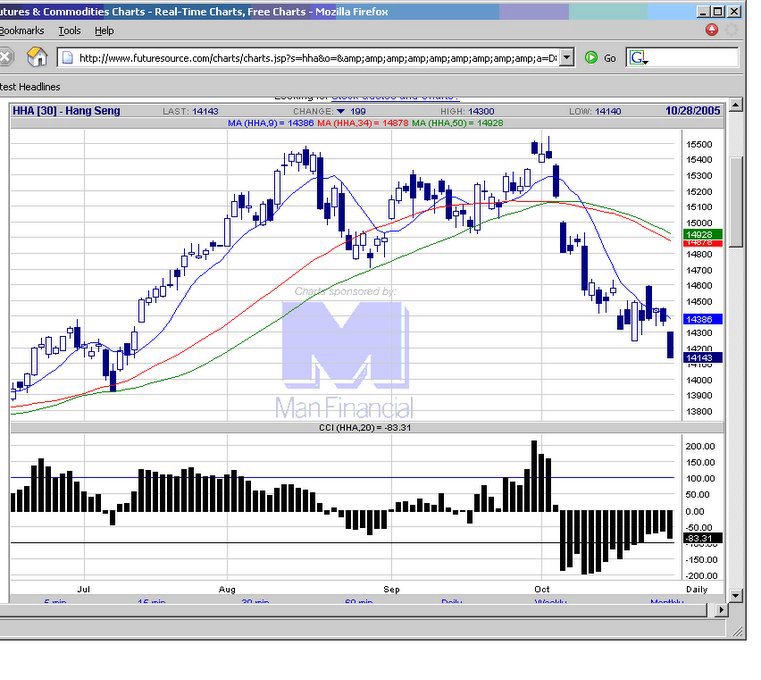 20051028 Another day of selling. With the Dow gaining on Friday night, the market is ripe for a rebound.
posted by emacro @ 10:01 AM
0 comments
![]()
![]()
 20051026 11:35 am. HSI futures 3 min chart shows a wedge pattern, a breakout either side of the trend lines of the wedge should see good move potential.
posted by emacro @ 11:37 AM
0 comments
![]()
![]()
 20051026 A hammer pattern on the candlesticks show buying interest, could signify the orderly retracement up could continue for another day or so.
posted by emacro @ 8:22 PM
0 comments
![]()
![]()
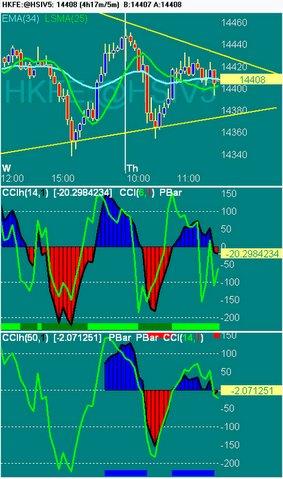
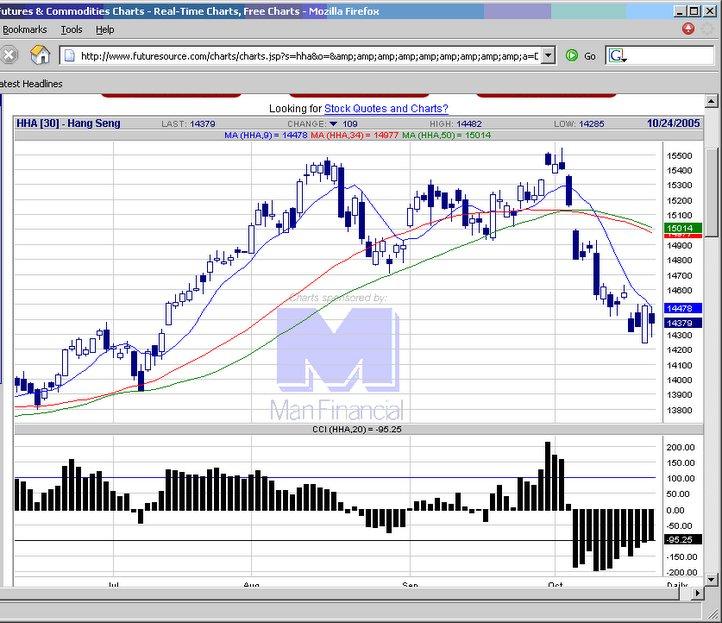 20051024 An ID pattern, indicating possibility of a breakout trade either long or short on break of the high or low of today's candlestick.
posted by emacro @ 7:23 AM
0 comments
![]()
![]()
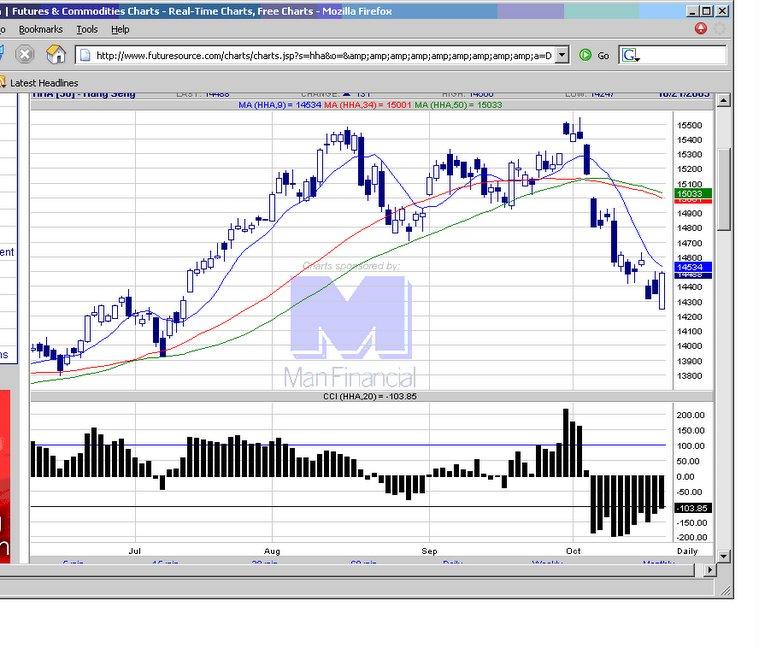 20051021 An engulfing bullish candlestick, indicating buying interest. Expect continuation to the upside next week.
posted by emacro @ 9:34 AM
0 comments
![]()
![]()
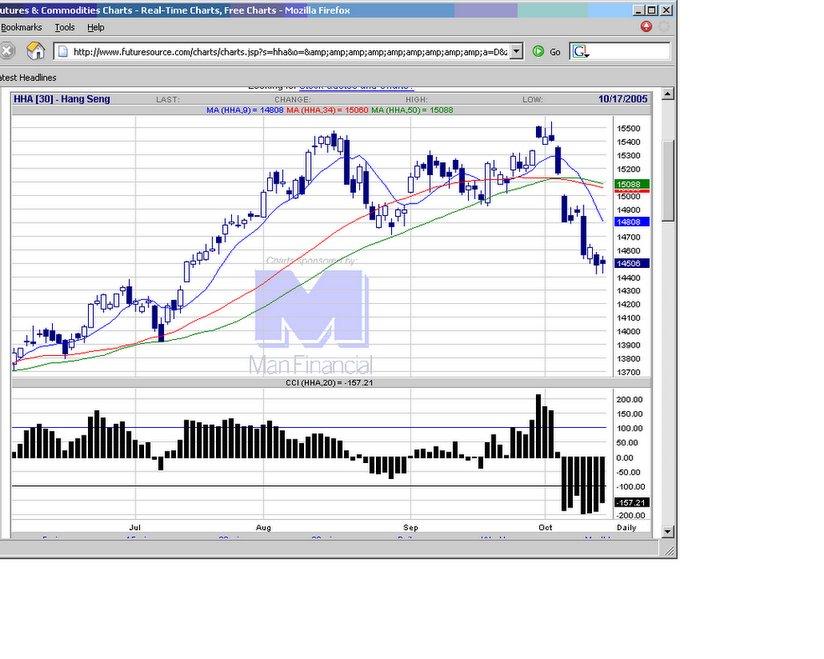
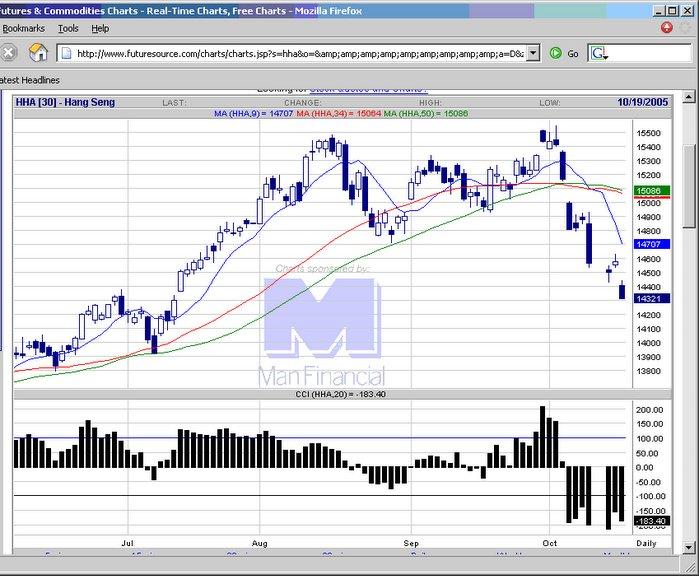 20051019 A buy stop placed at the low of yeterday (18 Oct) should be a good play for the retracement up, following Wall St gains on 19 Oct.
posted by emacro @ 8:07 AM
0 comments
![]()
![]()
 20051018 A rebound t last in the downtrend, could be more upside tomorrow.
posted by emacro @ 5:08 PM
0 comments
![]()
![]()
 20051014 Further selling pushes HSI to new 20 day lows, setting up a possible reversal trade. With Wall St rebounding, chances are good for meaningful bounce for the HSI.
posted by emacro @ 11:04 AM
0 comments
![]()
![]()
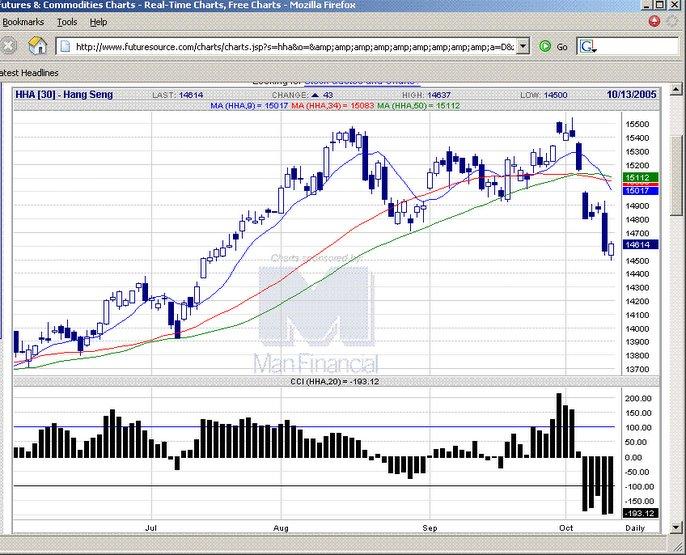 20051013 Tested below yesterday's low, so the buy stop to enter position 2 or 3 ticks above yesterday's low turned out to be good.
posted by emacro @ 5:58 PM
0 comments
![]()
![]()
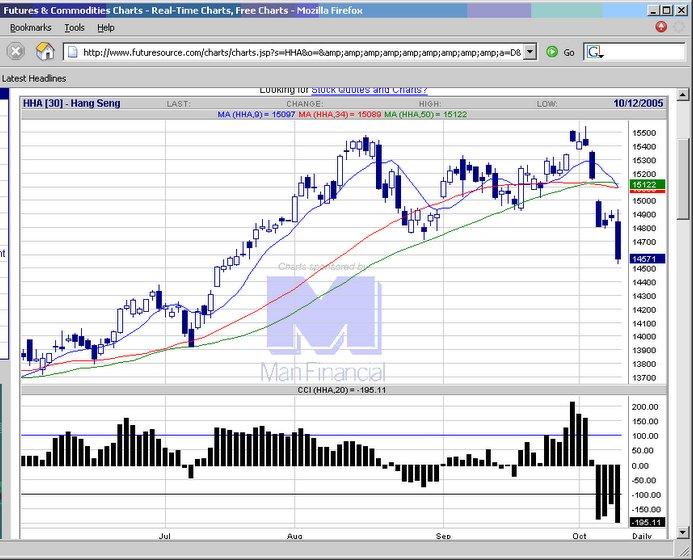 20051012 an 80-20 day. Buy on stop 1 or 2 ticks above the low after price trades lower than the low today.
posted by emacro @ 7:48 AM
0 comments
![]()
![]()
20051007 Another down day, but 3rd in a row still sets up a possible long, though the effect of the rebound may be less dynamic.

posted by emacro @ 10:14 AM
0 comments
![]()
![]()
20051006 Another big down day after a gap down. Would be looking for a long on a new gap down 7 Oct.

posted by emacro @ 9:26 AM
0 comments
![]()
![]()
20051005 Closing near moving average support. Selloff toda was pretty severe, expecting more to come in the days ahead.

posted by emacro @ 10:14 PM
0 comments
![]()
![]()
20051005 Lunch session close, big black candlestick after the gap down. Coming off overbought levels. Might use the 34 ema as a level to scalp trade longs.

posted by emacro @ 2:13 PM
1 comments
![]()
![]()
20050930 Consolidation after the big up day. Switch over to the October contract caused the gap, which indicates bullishness in the markets.

posted by emacro @ 8:49 AM
0 comments
![]()
![]()