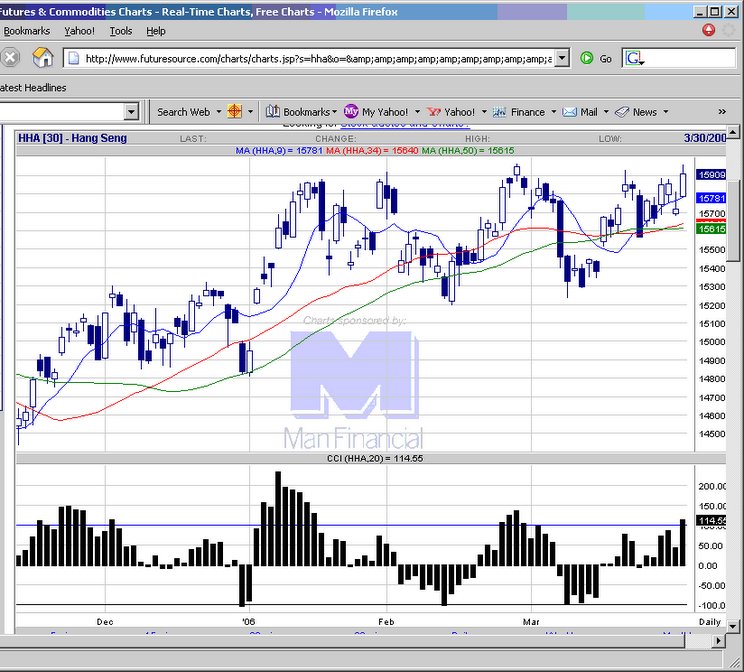
 20060330 HSI beaks out of consolidtion. Looking to buy pullbacks.
posted by emacro @ 8:40 AM
0 comments
![]()
![]()
The Hang Seng Index Futures (HSI) traded on the Hong Kong Exchange is a highly volatile trading instrument, which can lead to huge losses or gains. This will chronicle and log trade setups for this futures contract on an intraday basis. Using technical analysis to try to profit from swings in the market.
20060330 HSI beaks out of consolidtion. Looking to buy pullbacks.
posted by emacro @ 8:40 AM
0 comments
![]()
![]()
 20060329 An inverted hammer, which is a bearish formation. However need to confirm with price action, which if breaks 10 pts below the low, signal a short.
posted by emacro @ 7:23 AM
0 comments
![]()
![]()
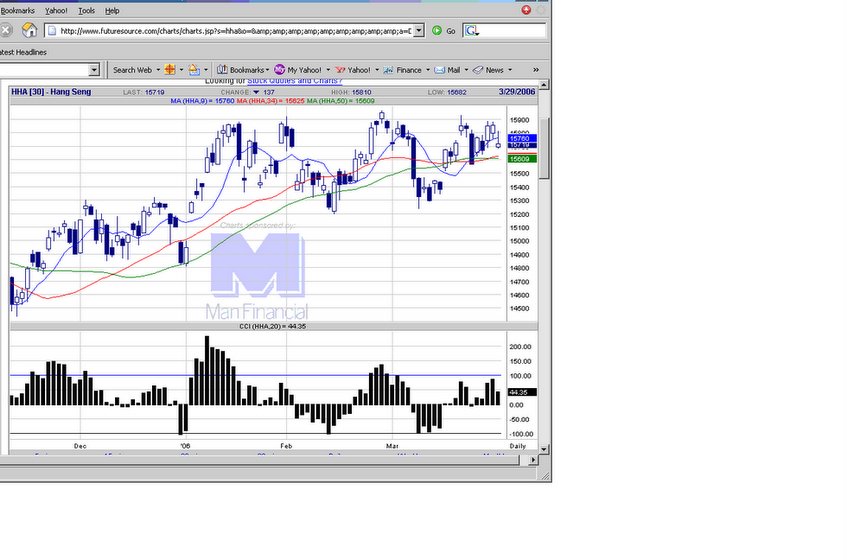
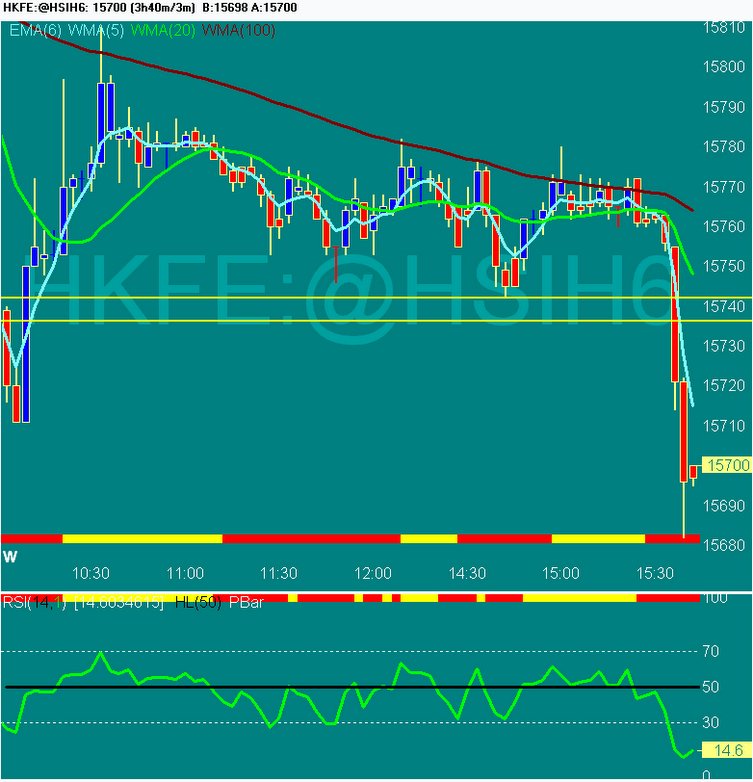 20060329 3:40 pm. A simple setup. 1. the 3 moving averages ocme together, indicating the sideways congestion 2 add/subtradt 25 pts from the 20 mov avg to get a trigger price to take breaks out of this range, in this case 15738 3. There is a further horizontal area of support 15741 close to the level identified previously. Shorts taked on breach of these 2 levels.
posted by emacro @ 3:47 PM
0 comments
![]()
![]()
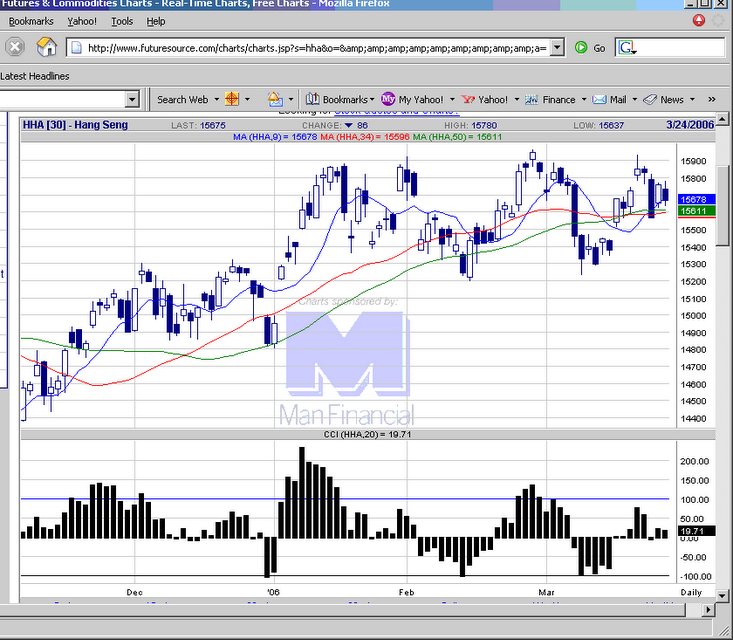
 20060323 ID inside day pattern on candlestick indicates breakout either side possible.
posted by emacro @ 8:29 AM
0 comments
![]()
![]()
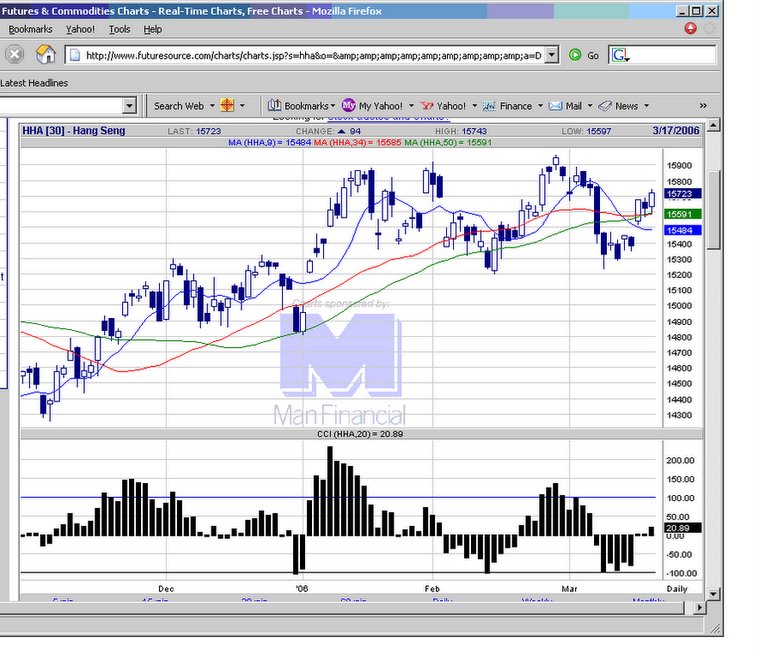 20060317 HSI futures continues the move up after the breakout of the consolidation.
posted by emacro @ 11:00 AM
0 comments
![]()
![]()
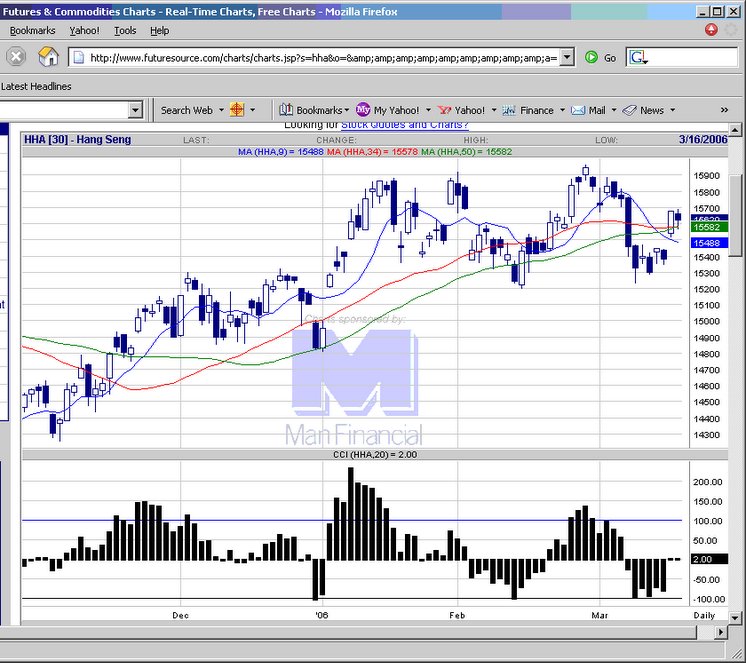 20060316 HSI daily chart shows consoidation after breakout of range. Expecting some continuation of upside.
posted by emacro @ 9:09 AM
0 comments
![]()
![]()
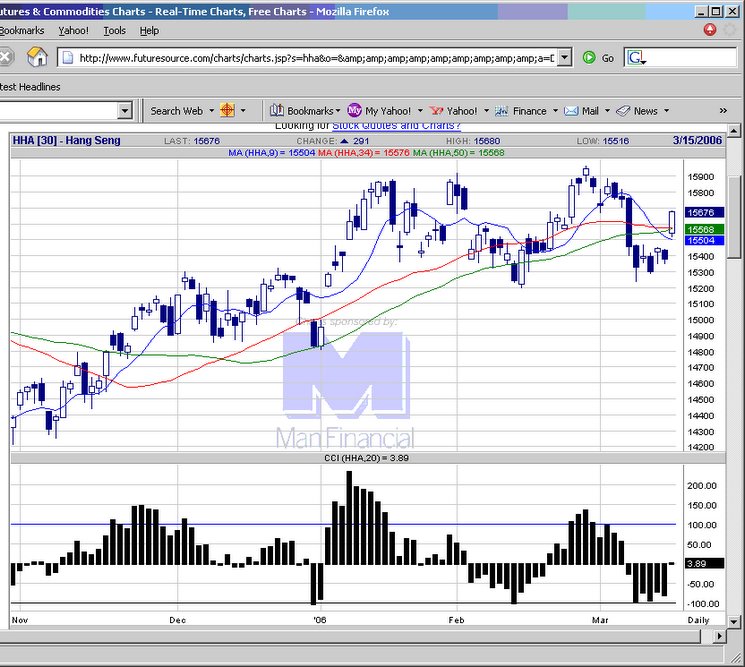 20060315 The expected move out of the consolidation range, albeit with a gap up.
posted by emacro @ 11:06 PM
0 comments
![]()
![]()
 20060314 HSI is scribing sideways range, looking for the breaout that might lead to follow through.
posted by emacro @ 11:40 PM
0 comments
![]()
![]()
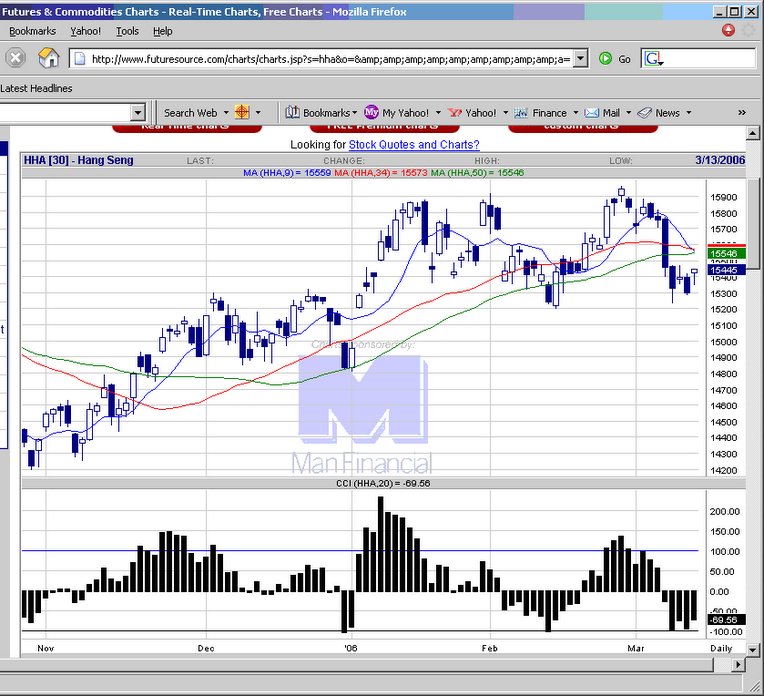 20060313 Hammer formation indicates bullish reversal from recent down move.
posted by emacro @ 8:16 AM
1 comments
![]()
![]()
 20060308 Another day of down candlestick. A good trade idea would be to wait for takeout of the low of 50 pts, for the long trade.
posted by emacro @ 7:33 AM
0 comments
![]()
![]()
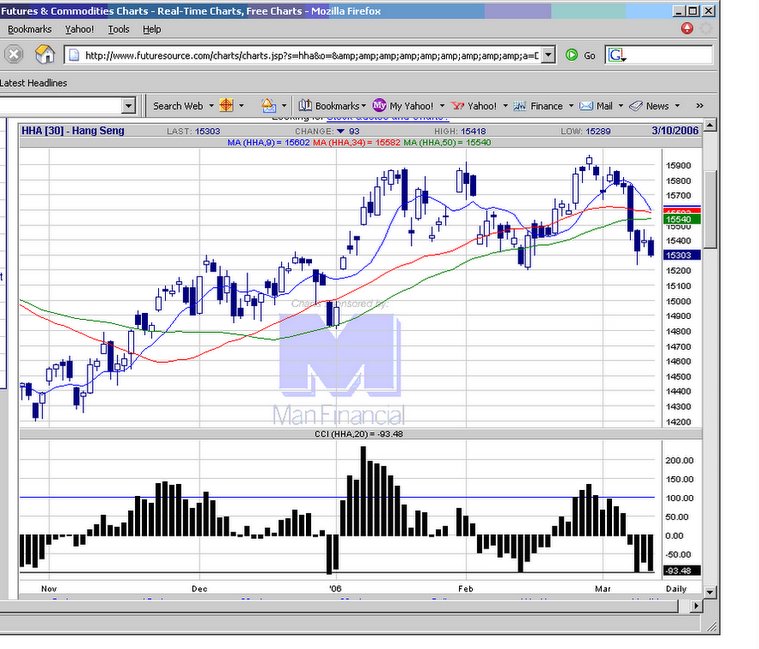
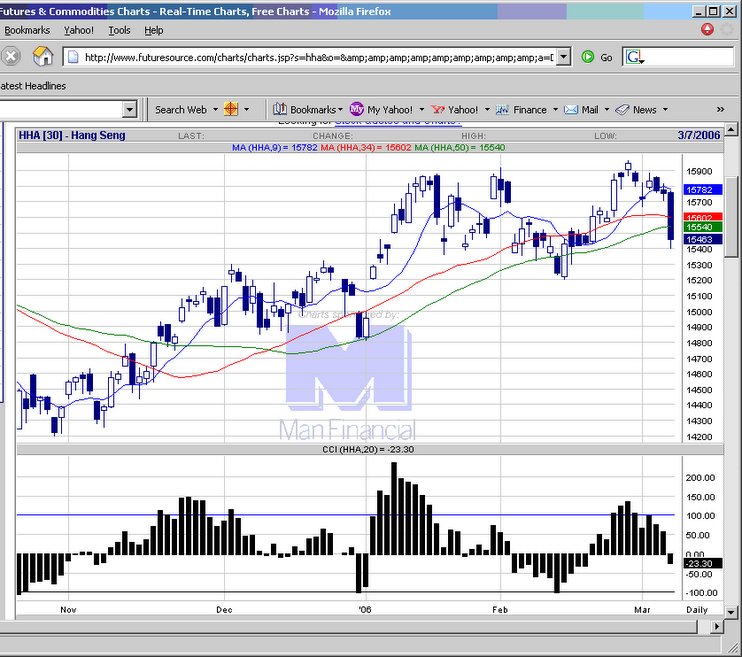 20060307 Breaks down throg multiple support. 15550 can ba a good level to short, if bounce up to there.
posted by emacro @ 8:02 AM
0 comments
![]()
![]()
 20060303 How the long trade ended up. Key is how the trade is managed.
posted by emacro @ 2:32 PM
0 comments
![]()
![]()
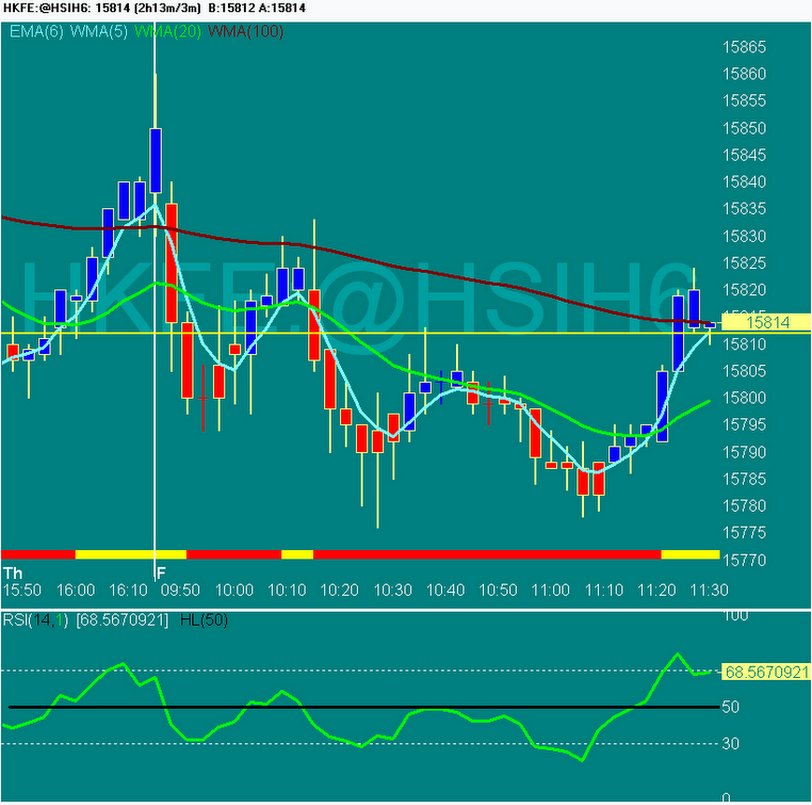 20060303 11:30 am. Took long 15812 with stop 15789 on mov avg crossover.
posted by emacro @ 11:32 AM
0 comments
![]()
![]()
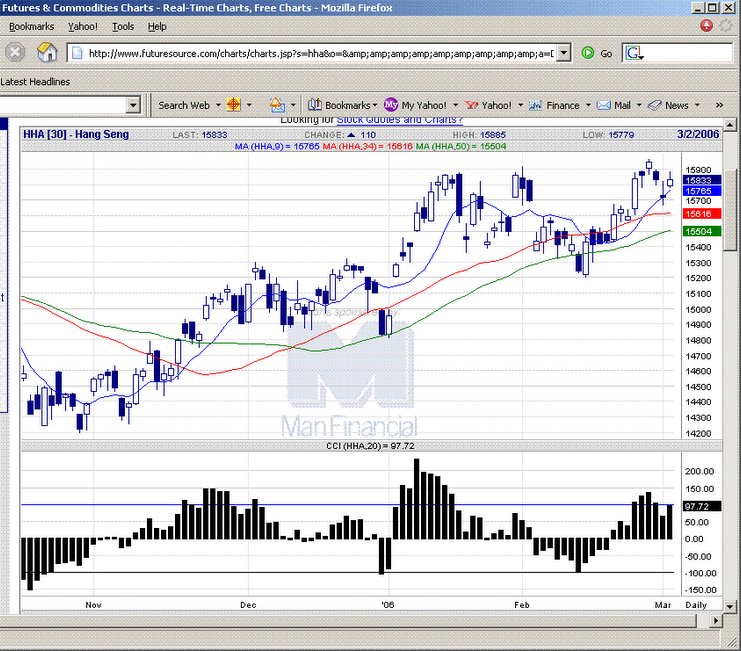 20060302 A possible 123 reversal forming. Good trigger would be the low of today's bar to go short. (if the pattern plays out)
posted by emacro @ 5:30 PM
0 comments
![]()
![]()
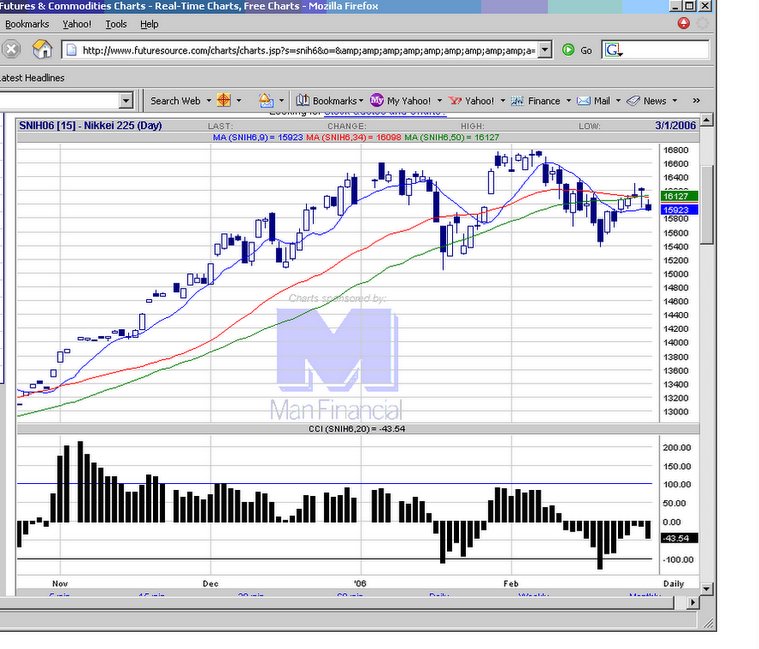 20060302 Moving averages flatten out. Maybe a period of consolidtion before the next trend.
posted by emacro @ 8:14 AM
0 comments
![]()
![]()