Tuesday, August 30, 2005


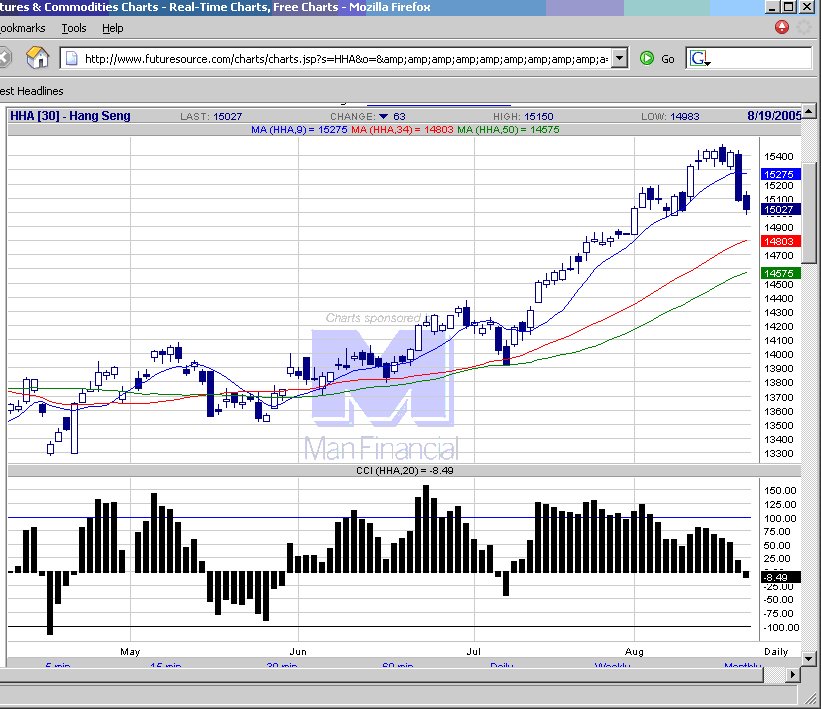
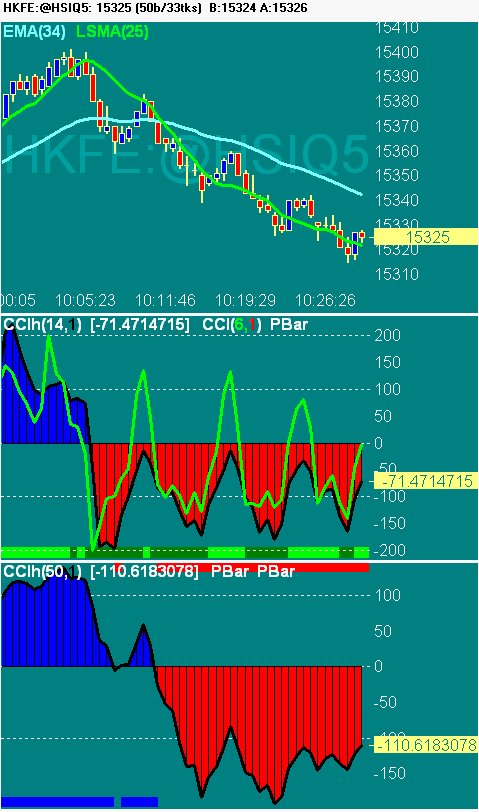
20050830 14963 the moving average level tested on upside today and held. HSI needs to close above this to bring it out of danger. Candlestick today is a doji with a slightly bigger body, basically sideways, battle between bulls nd bears. Posted by Picasa


20050829 HSI found support at the Moving average and bounced off in technical rebound. Posted by Picasa

Monday, August 29, 2005

20050829 3:45 pm. CCI(50) crossed below +100 indicates time to get out. Small profit, after going about +31 from the entry point, waiting for next trade. Posted by Picasa

20050829 3:37pm stop moved to 14787, so now risking 4 pt, to hold to closing today. Posted by Picasa

20050829 3:13pm. Triggered long at 14791 stop at 14756. Posted by Picasa

20050829 3:06 pm. A possible trade if HSI Sep crosses above the upper trend channel and CCI (50) crosses upside zero at the same time.  Posted by Picasa

Saturday, August 27, 2005


20050826 Continuing on the technical rebound. Facing resistance at the moving average, CCI momentum still showing downside. Posted by Picasa

Friday, August 26, 2005


20050825 Some buying support as expected, but still weak as bounce is technical due to extremely oversold conditions. Possible sell level 15131 for short scalp. Posted by Picasa

Thursday, August 25, 2005

20050824 Broke major support of the time yesterday. This severe retracement needs to find the moving average support at 14637. Scalping long at the red moving average yesterday was just that, scalp and get out quick. Posted by Picasa

Wednesday, August 24, 2005

20050823 Another big black candlestick indicates heav selling. Expect further weakness today to test the moving average support levels for the scalp trade long. Posted by Picasa

Tuesday, August 23, 2005

20050822 15297 is the moving avg level where a short trade for the retest of the lows is indicated. Posted by Picasa

Saturday, August 20, 2005

20050819 Further selling after the big down day. Looking for moving average support for buy scalp trades. Posted by Picasa

Friday, August 19, 2005

20050818 End of day, the market really tanked. The moving average levels provide support. Posted by Picasa

Thursday, August 18, 2005

20050818 12:30 pm updated chart at midday break. Looks like more selling came in in the morning. Needs to go back above the high of the morning to negate downside. Posted by Picasa

Wednesday, August 17, 2005

20050816 Posted by Picasa

Saturday, August 13, 2005

20050812 Another new high, just. 15198 is the previous 20 day high made 6 days ago, so this level remains focus of 'turtle soup' reversal short traders, if it ever comes. Range today was small, not quite an ID (inside day) but may be a good short if today's low taken out on Monday for a swing trade, since the turtle soup reversal level is so far away. Posted by Picasa

Thursday, August 11, 2005

20050811 10:29 am HK time. An example of a confluence of signals short trade today. Posted by Picasa

Wednesday, August 10, 2005

20050810 Big candlestick indicates buying taking the HSI to new highs. CCI rejects zero line, got to see whether upside momentum builds enough t take CCI above +100. Posted by Picasa

Tuesday, August 09, 2005

20050809 Big buying candle followed by big selling candlestick today. Divergence is still there, so maybe the HSI is retracing to alleviate the overbought conditions. Best to wait for the next clear cut signal, although some can try the aggressive short trade, given the closing below the moving average. Posted by Picasa

Saturday, August 06, 2005

20050805 Divergence prevailed and downside move after the doji candlestick. Support comes in t the moving average 14963. Note toady Macquarie Equities put a target 17,500 for HSI. Posted by Picasa

Friday, August 05, 2005

20050804 Divergence formed. Doji candlestick today. With Wall street dropping on Aug 4, look for selling pressure for downside move in morning. Posted by Picasa

Thursday, August 04, 2005

20050803 Selling interest in yesterday's candle. Divergence forms on CCI. Posted by Picasa

Wednesday, August 03, 2005

20050802 The bull continues unabated, helped by the previous day's good results of HSBC. Looking at the 1 August candlestick, it was a big white candle, opening at the low and closing at the high. Normally after such a pattern, the next day indicates folow through or at least close off any lows. Objectively, HSI looks overbought, maybe longs should look to lock in some profits. Posted by Picasa

Tuesday, August 02, 2005

20050801 Break above psychological 15,000 level. CCI pattern indicates momentum is still intact on upside. Posted by Picasa