20060830 HSI futures.
posted by emacro @ 12:12 PM
0 comments
![]()
![]()
The Hang Seng Index Futures (HSI) traded on the Hong Kong Exchange is a highly volatile trading instrument, which can lead to huge losses or gains. This will chronicle and log trade setups for this futures contract on an intraday basis. Using technical analysis to try to profit from swings in the market.
 20060825 An Inside day forms on HSI, possible breakout either side.
posted by emacro @ 9:54 AM
0 comments
![]()
![]()
 20060824 3:20 pm. HSI broke the lows as expected, indicating shorts in play.
posted by emacro @ 3:30 PM
0 comments
![]()
![]()
 20060823 HSI looking for short trade on break of the lows made day before yesterday.
posted by emacro @ 8:26 AM
0 comments
![]()
![]()
 20060823 11:35 am. After 35 mins, the gap closing trade works pretty well.
posted by emacro @ 12:01 PM
0 comments
![]()
![]()
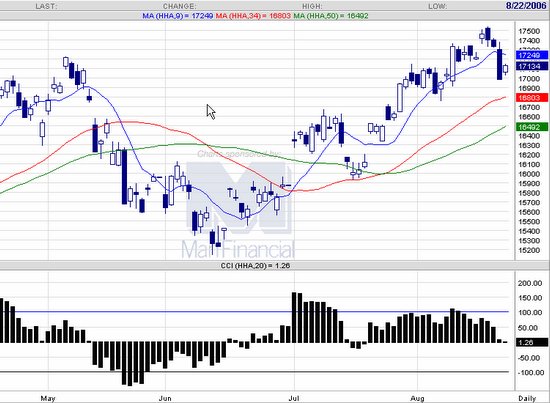 20060822 HSI inside day pattern. Looking for breakout either side.
posted by emacro @ 10:02 AM
0 comments
![]()
![]()
 20060821 HSi correction. 16780 may be a good level to consider longs.
posted by emacro @ 9:50 AM
0 comments
![]()
![]()
 20060821 3:22 pm. HSI in a downtrend. Tweezer top provided the trigger for the short.
posted by emacro @ 3:30 PM
0 comments
![]()
![]()
 20060818 The expected weakness on HSI today did eventuate, ahead of weekend. Not surprising as longs would like to lock in gains.
posted by emacro @ 4:59 PM
0 comments
![]()
![]()
 20060817 HSI shows a combo dark cloud cover/engulfing bearish candlestick, so HSI futures should see some weakness and corredtion ahead.
posted by emacro @ 5:31 PM
0 comments
![]()
![]()
 20060817 11:54 am. Sometimes the simplest trading method (Bollinger band breakout) can be very effective.
posted by emacro @ 12:30 PM
0 comments
![]()
![]()
 20060816 11:21 am. HSI short indicated on close below trendline.
posted by emacro @ 11:33 AM
0 comments
![]()
![]()
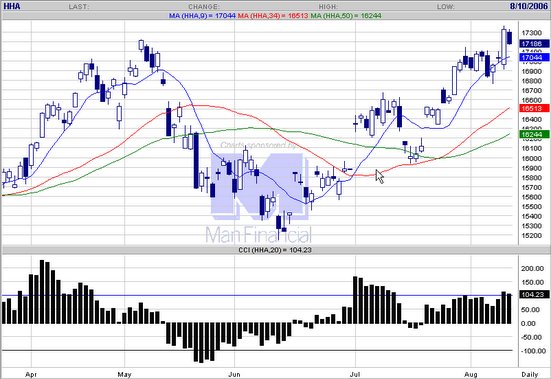
 20060811 Uptrend still intace. Inside day candle, so looking for breakout either side.
posted by emacro @ 4:10 PM
0 comments
![]()
![]()
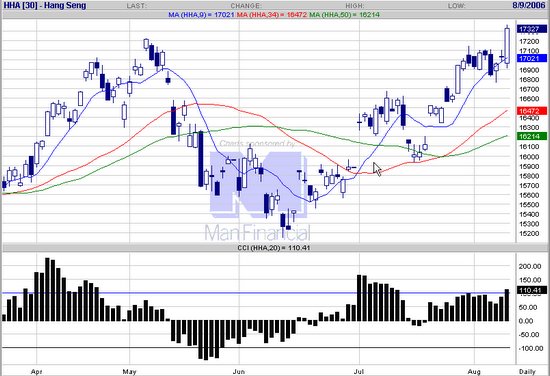
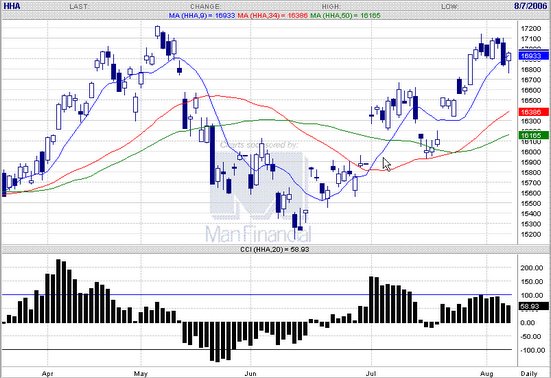 20060807 HSI hammer formation in uptrend. If price cannot hold above today's levels tomorrow, then will turn bearish. Crude Oil spike to above US76 per barrel in Asian trade due to shutdown of biggest US oilfield.
posted by emacro @ 5:37 PM
0 comments
![]()
![]()
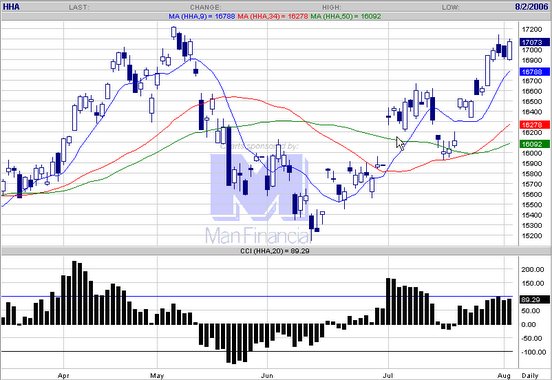
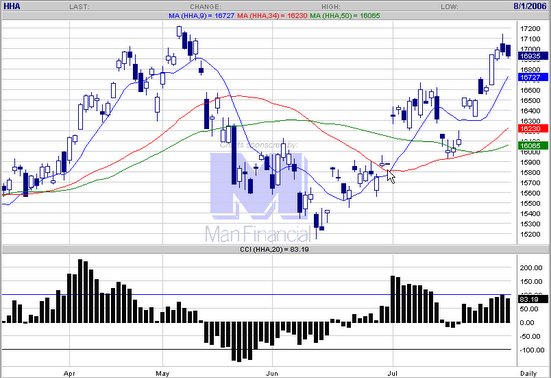 20060801 HSI daily chart. Black candles indicate no conviction going up.
posted by emacro @ 9:21 AM
0 comments
![]()
![]()